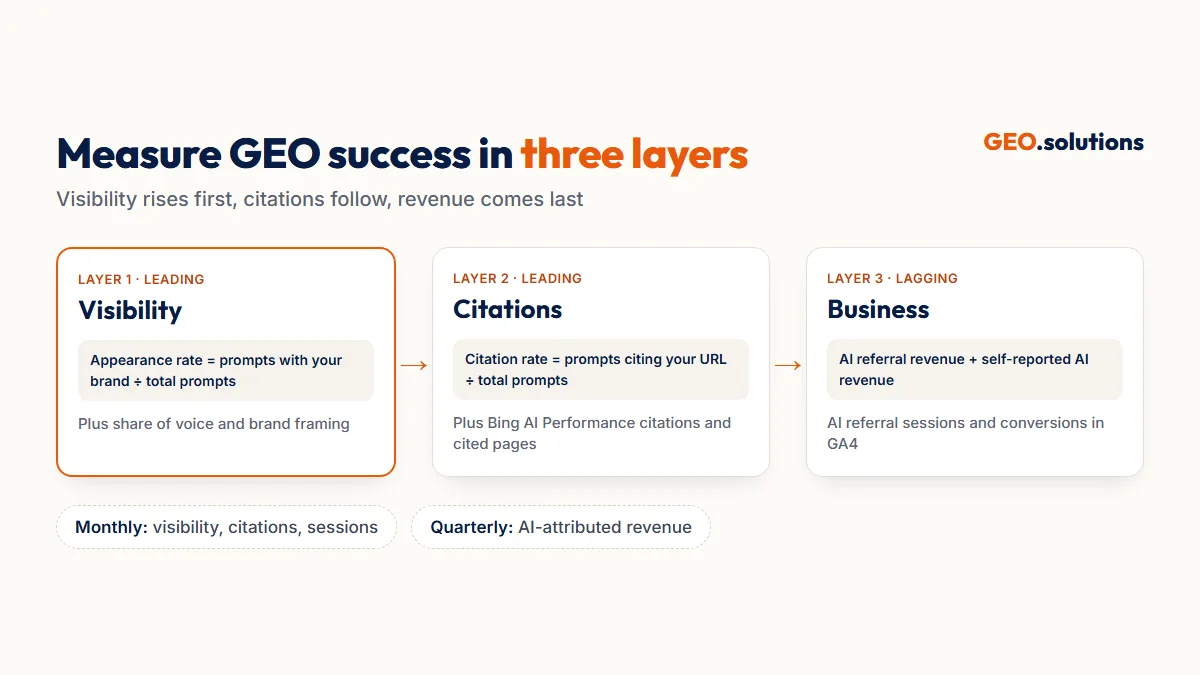
Measure GEO success in three layers:
- Visibility: how often AI engines mention your brand.
- Citations: how often they link to your pages.
- Business results: the traffic and revenue those answers send you.
Track appearance rate and share of voice first, then citations, then AI referral conversions. All of this data is sampled and incomplete, and this guide is plain about the gaps.
Most GEO measurement advice lists metrics without saying how to calculate them or where the data comes from. Below, each KPI has a formula, a data source and a reporting cadence. There’s also a scorecard you can use from your first month.
The Three Layers of GEO Measurement
GEO metrics move in sequence. Visibility rises first, citations follow, and traffic and revenue come last.
Leading vs Lagging Indicators
Leading indicators tell you whether the work is changing what AI engines say. Lagging indicators tell you whether those changes pay off. Report both, and don’t treat one as proof of the other. A July 2026 critical survey of GEO research rated the link from citation scores to revenue as very low confidence.
Why Rankings Don’t Apply
AI answers have no stable rank to track. In a 2026 SparkToro and Gumshoe study, the same brand list repeated less than 1% of the time across nearly 3,000 runs of identical prompts, and in the same order about 1 time in 1,000. Track how often you appear, not where.
Visibility Metrics
Visibility metrics measure whether AI engines name your brand when buyers ask about your category. You collect them by running a fixed set of buyer prompts across AI engines. The method is covered in How to Run a GEO Audit.
Appearance Rate
Appearance rate = prompts where your brand appears ÷ total prompts tested. Run each prompt several times, and count it as an appearance only when your brand shows up in most runs. This is the stable signal in noisy data. In the SparkToro study, some brands appeared in 60% to 90% of answers for a given intent.
Share of Voice
Share of voice = your brand mentions ÷ total mentions of you plus your competitors across the prompt set. It shows your slice of the category in AI answers. Calculate it separately for each engine, because a strong ChatGPT score can hide a weak Copilot one.
Brand Framing
Brand framing is how AI engines describe you, such as “a budget option” or “best for enterprise teams.” Log the exact wording each month. Framing shows whether the positioning in your content is the positioning AI engines repeat.
Citation Metrics
Citation metrics measure whether AI engines send buyers to your site as a source, not just name you. A citation is a link. A mention isn’t.
Citation Rate
Citation rate = prompts where your own URL is cited ÷ total prompts tested. A high appearance rate paired with a low citation rate means AI engines know your brand but cite third-party sites as the source.
Bing AI Performance Citations and Cited Pages
Bing Webmaster Tools’ AI Performance report is the only first-party citation data from a major AI engine. It covers Microsoft Copilot and exports three datasets:
- Daily overview: total citations and unique pages cited per day.
- Page-level stats: which of your URLs were cited and how often.
- Grounding queries: the retrieval queries that triggered citations.
Track total citations for volume, and cited pages for breadth. A rising count of cited pages means AI engines trust more of your site.
Grounding Queries
Grounding queries show what Copilot actually searched for when it cited you. Compare them with your target prompts. Grounding queries you didn’t expect point to subtopics worth their own sections or pages.
Traffic and Business Metrics
Business metrics measure the visits, leads and revenue that AI answers send you. These are the KPIs that justify budget.
AI Referral Sessions
AI referral sessions are visits from AI engines, such as chatgpt.com, perplexity.ai, gemini.google.com and copilot.microsoft.com. Group them into one channel in GA4, then track sessions, engagement and conversions separately from organic search.
Conversions and Self-Reported Attribution
AI-attributed revenue = revenue from AI referral sessions + revenue from buyers who report finding you through an AI assistant. Many AI-influenced buyers arrive later through branded search or a direct visit, so analytics alone undercounts them. Add “ChatGPT or another AI assistant” as an option on lead forms and checkout surveys.
The Limits of GEO Data
All GEO data is sampled, partial or estimated, and no tool shows the full picture. Plan your reporting around these limits rather than hiding them.
Sampling and Variance
- Prompt tests are samples. AI answers vary on every run, so any prompt-based metric carries noise. Larger prompt sets and repeated runs reduce that noise, but never remove it.
- Bing’s report is in preview. Bing describes the data as sampled and subject to refinement. It offers no API yet.
- Citation counts can run high. One Copilot conversation can trigger several citation events through query fan-out. Search Influence estimated 3 to 5 per conversation in its own data, so 20,000 citations may reflect far fewer conversations.
What No Tool Shows
- Google AI Overviews: Google Search Console has no separate AI Overviews filter. Google counts that traffic within the standard “Web” search type.
- ChatGPT, Perplexity and Gemini: none offers a citation dashboard.
- Clicks from Copilot answers: Bing’s report shows citations, not click-throughs.
- Competitors in Bing: Bing’s report doesn’t show which other sites were cited for the same queries.
- Traffic source certainty: in Centerfield’s survey of 878 US marketers, only a third were highly confident they could tell AI search traffic from traditional search traffic.
These gaps make GEO harder to run than SEO. They’re covered in more depth in GEO Challenges and Common Mistakes.
Tools for Measuring GEO Performance
Start with three free first-party tools, then add a prompt-tracking platform when manual testing stops scaling.
Free First-Party Tools
- Bing Webmaster Tools: Copilot citations, cited pages and grounding queries.
- Google Search Console: overall Web search clicks and impressions, which include AI Overviews and AI Mode traffic.
- GA4: AI referral sessions and conversions.
These three cover citations, search traffic and on-site results at no cost.
Prompt-Tracking Platforms
Paid platforms run your prompt set automatically across engines and chart appearance rate and share of voice against competitors. They fill the gap left by engines with no dashboard. Compare them in our roundup of the best generative engine optimization tools. Manual tracking in a spreadsheet works well up to about 30 prompts.
A GEO KPI Scorecard
Report six KPIs, each with a fixed formula, source and cadence.
Monthly Reporting
Report the five leading and traffic KPIs every month, with the same prompts, engines and test conditions each time. Note any content, off-page or technical change made that month, so movement can be traced to a cause.
Quarterly Reviews
Review AI-attributed revenue and the overall trend every quarter. Three months is the shortest window that smooths out run-to-run variance and recrawl delays. Compare against pages or prompts you didn’t work on, so seasonal changes aren’t mistaken for GEO results.
Conclusion
GEO success is measured in three layers. Appearance rate and share of voice show whether AI engines name you. Citation rate and Bing citations show whether they send buyers to you. AI referral revenue shows whether it pays. Track all six KPIs on a fixed schedule, and be open about the data’s limits: it’s sampled, Google hides AI Overviews inside its Web report, and no tool shows everything.
Measure appearance, not rank, and judge results quarterly, not daily.
Get a Measured Baseline for Your Brand
GEO.solutions sets your starting numbers with the same KPIs used above. The GEO Audit tests your buyer prompts across AI engines and reports where competitors are cited instead of you. The Pro tier covers 30 prompts across 5 engines for $290, delivered in 5 days.
Frequently Asked Questions
How do you measure the success of generative engine optimization?
Measure appearance rate and share of voice across a fixed prompt set, then citation rate and Bing AI Performance citations, then AI referral sessions and revenue in GA4. Report the first two layers monthly and revenue quarterly.
What are the main GEO KPIs?
The six main GEO KPIs are appearance rate, share of voice, citation rate, Copilot citations and cited pages, AI referral sessions and AI-attributed revenue.
What is the best tool for measuring GEO performance?
Start with free first-party tools: Bing Webmaster Tools for Copilot citations, Google Search Console for search traffic and GA4 for AI referrals. Add a prompt-tracking platform when manual testing passes about 30 prompts.
Can Google Search Console show AI Overviews traffic?
Not separately. Google counts AI Overviews and AI Mode traffic within the standard “Web” search type in the Performance report.
Why do GEO metrics change so much month to month?
AI engines generate a fresh answer for each request, so prompt-based metrics carry noise. A 2026 SparkToro study found the same brand list repeated less than 1% of the time. Use repeated runs and quarterly trends.
What is the difference between appearance rate and citation rate?
Appearance rate counts prompts where AI engines name your brand. Citation rate counts prompts where they link to your own URL as a source. Only citations can send traffic.
Sources
- Search Influence: Inside Bing’s AI Performance Report
- Search Engine Land: AI recommendation lists rarely repeat (SparkToro/Gumshoe)
- Google Search Central: AI features and your website
- Search Engine Land: Marketers aren’t ready for GEO (Centerfield)
- A Critical Survey of Generative Engine Optimization (Martinez, July 2026)
- Muck Rack: How to track GEO through PR metrics (SERP competitor)